— award-winning product design leader and mentor
— award-winning product design leader and mentor
with 20+ years of experience driving innovation through design, collaborating with Cartier, Google, and UCI, and focusing on how people think and innovate.
with 20+ years of experience driving innovation through design, collaborating with Cartier, Google, and UCI, and focusing on how people think and innovate.
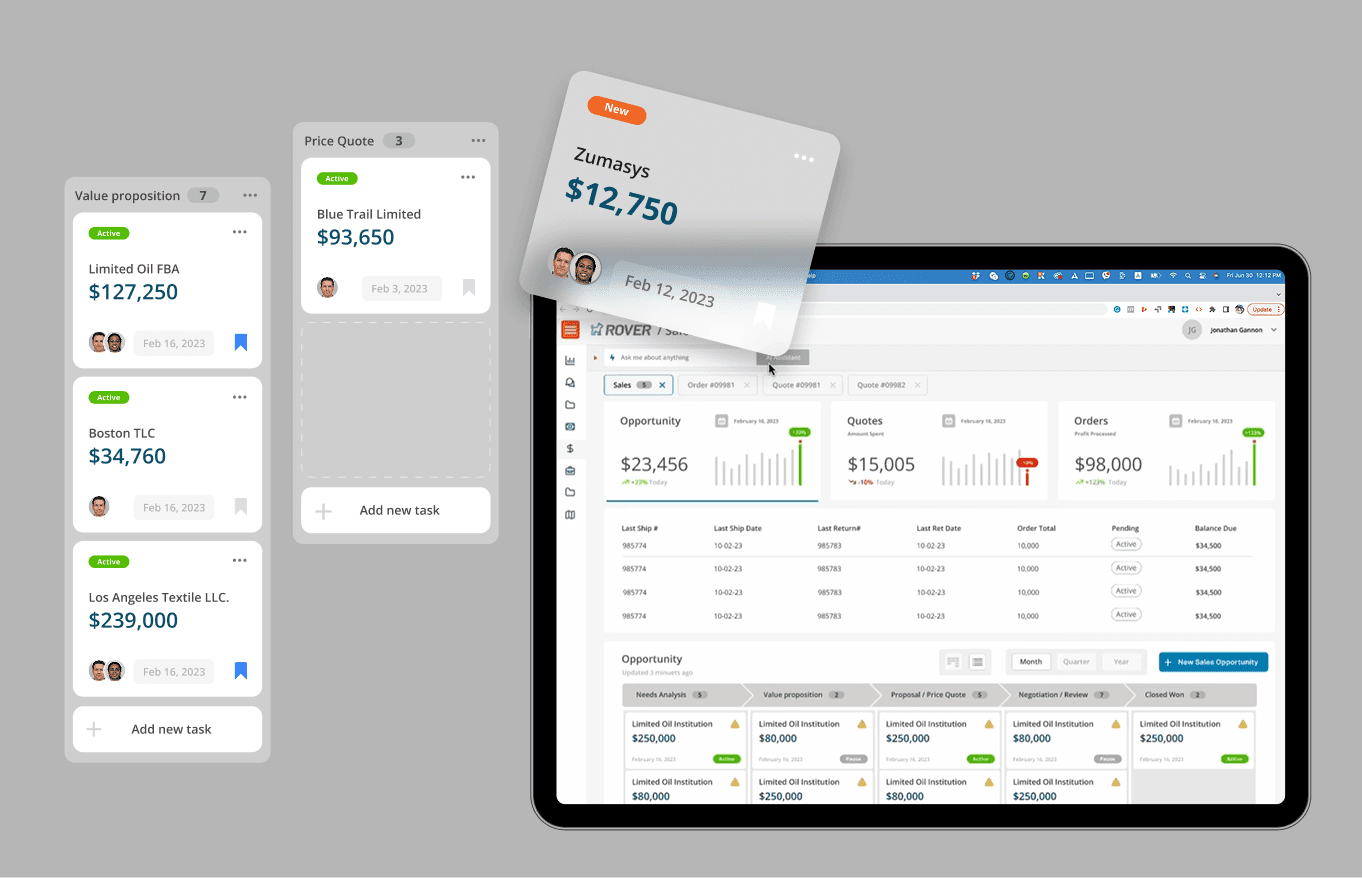
+45% increase in Daily Active Users (DAU) within 3 months of launch
Average session duration increased by 32% after dashboard redesign
27% boost in account sign-up conversions following an improved registration flow
17% decrease in churn rate due to improved onboarding and in-app guidance
38% increase in successful KYC verifications after UX optimization
30-day retention increased from 42% to 58%
Data-Driven Results
Data-Driven Results
Data-Driven Results
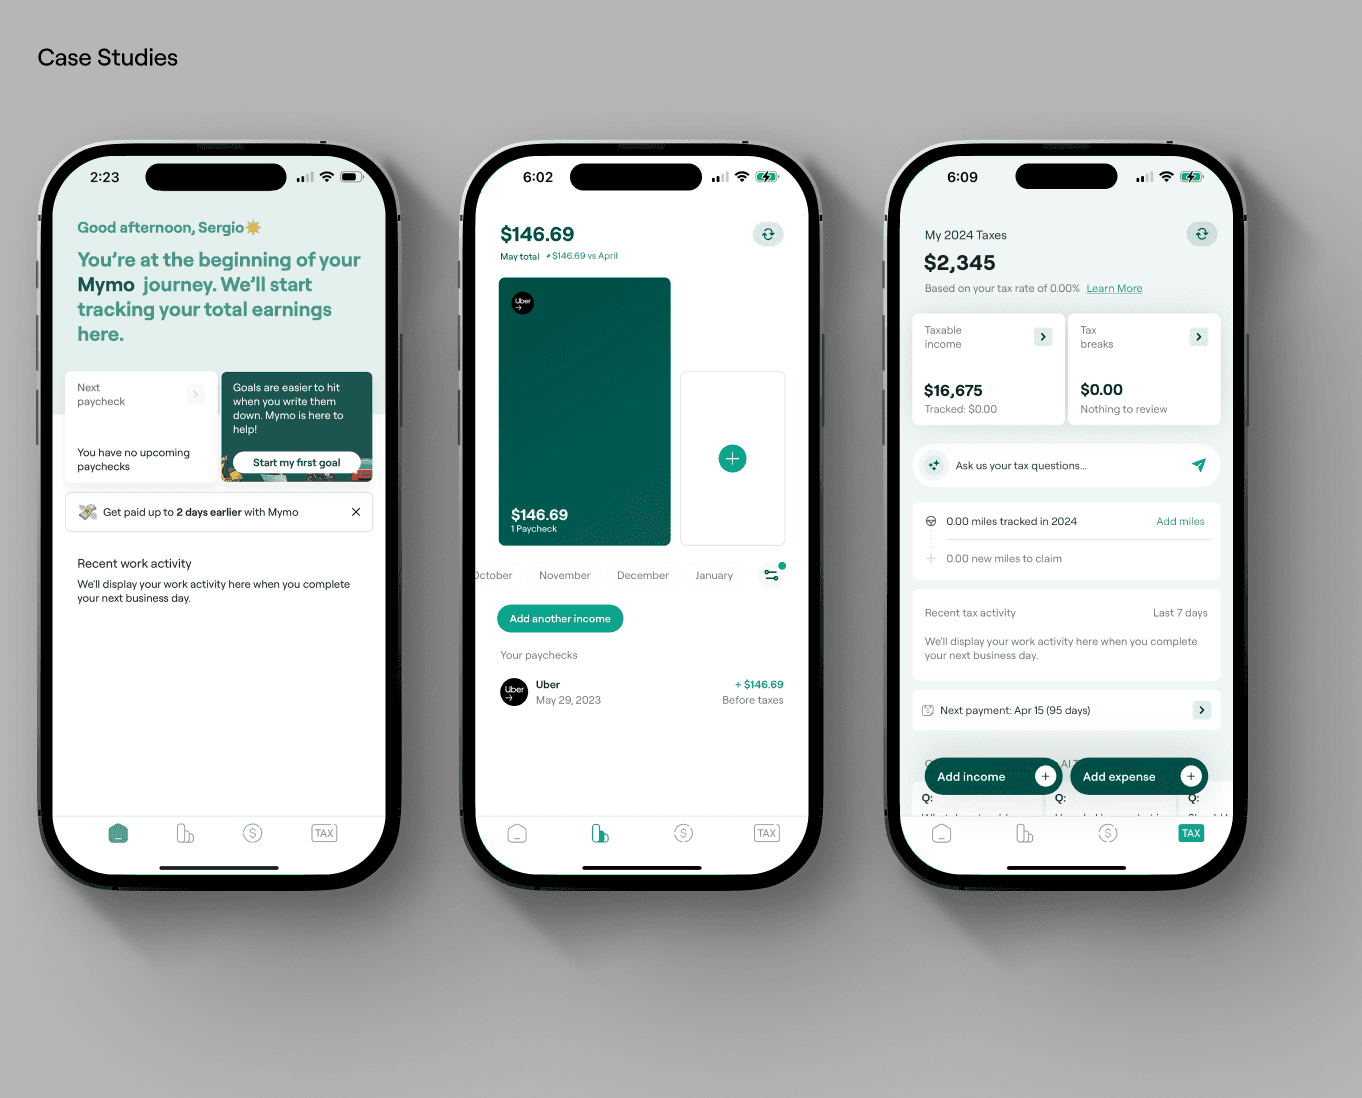
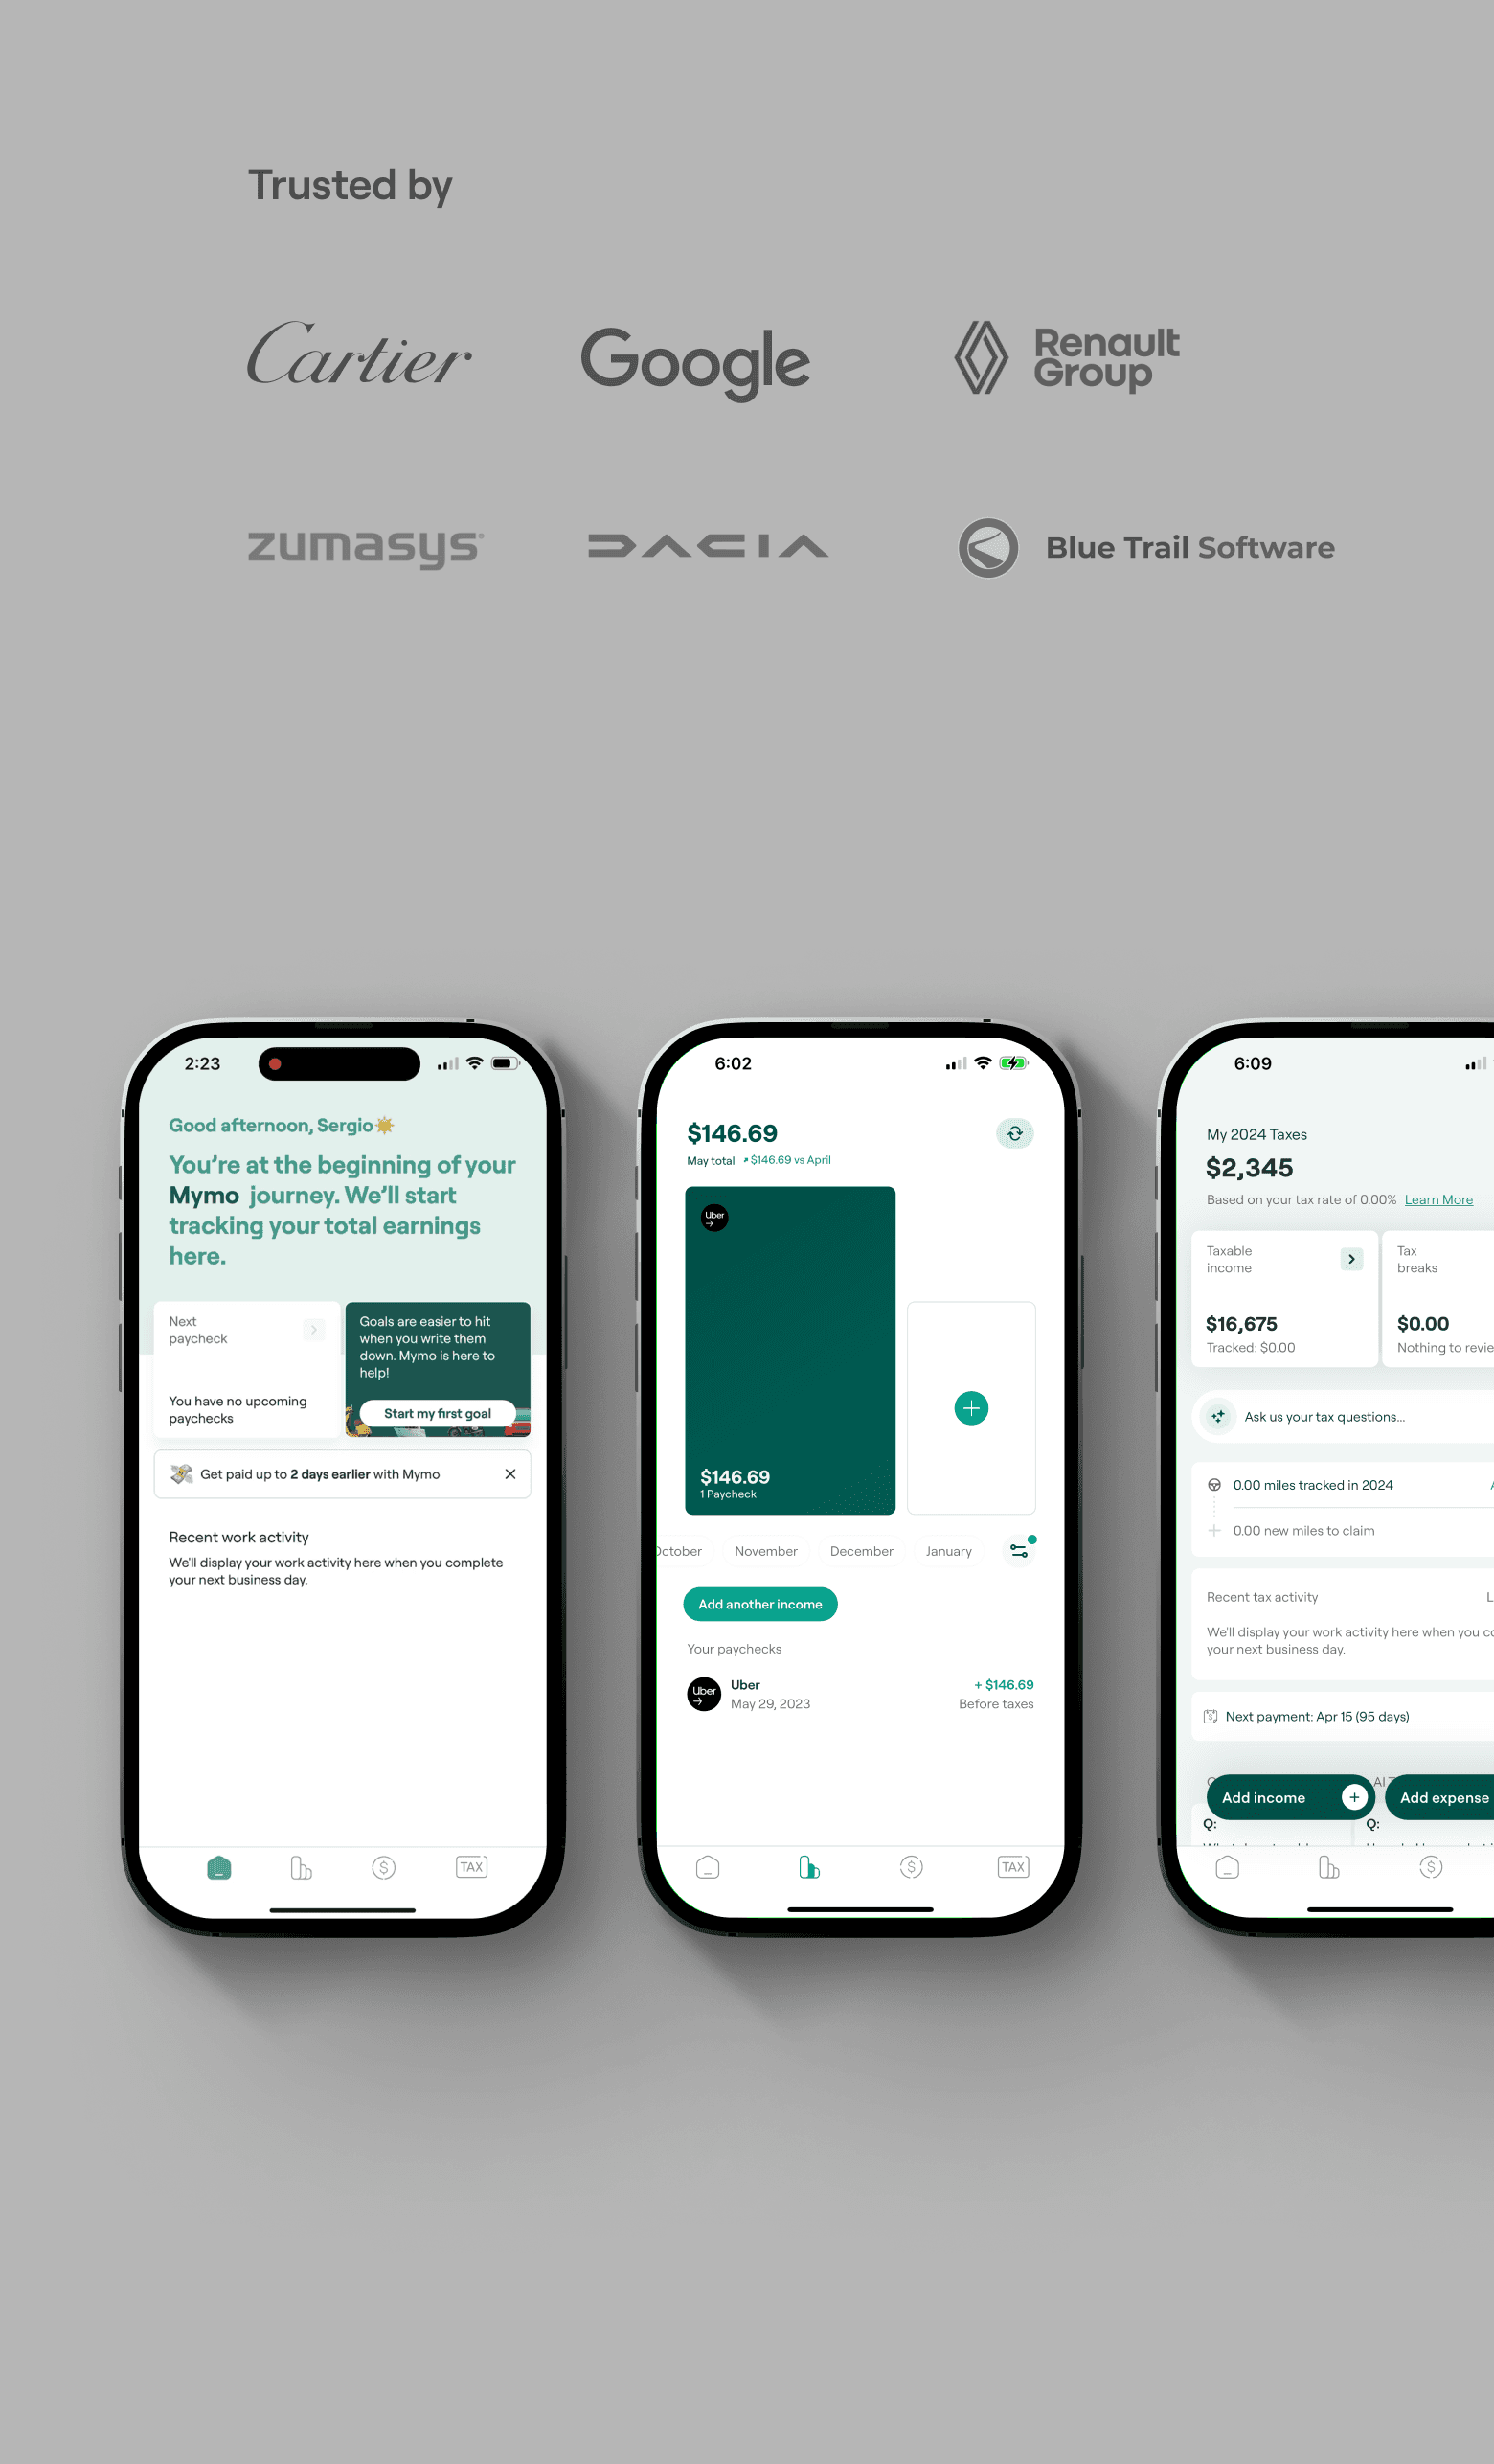
As a UX and Product Designer, I led the design and strategy for a MVP of a Fintech Application. Launching this app enabled the company to sell the product to major clients, driving significant growth in DAU.
An Approach to Financials Digitization
Task completion time reduced by 41% after streamlining workflows
32% fewer clicks required for core actions (e.g., generating invoices, approving budgets)
Reduction in training costs by 35% due to more intuitive navigation and contextual guidance
Data entry errors decreased by 47% after introducing form validation and improved UI feedback
Annual operational savings of $250K+ due to faster task execution and fewer manual processes
Data-Driven Results
As a Lead Product Designer, I Led the full redesign of a complex ERP system, managing a cross-functional team to improve usability and operational efficiency. Conducted deep UX research through surveys, usability testing, and analytics.
Redesign of a complex ERP system

+28% increase in assisted sales for items not available in-store
83% of users described the experience as “memorable” or “emotionally impactful”
Reduced need for physical inventory by 21% in pilot stores
Zero reported UX friction or crashes during over 500+ AR sessions
52% decrease in customer wait time
Data-Driven Results
As a Lead Product Designer, I designed an immersive in-store AR experience for Cartier, bridging the physical and digital retail worlds. I collaborated with AI and AR engineers to create a seamless product visualization tool that renders unavailable jewelry items in real time on an iPad.
As a Lead Product Designer, I designed an immersive in-store AR experience for Cartier, bridging the physical and digital retail worlds. I collaborated with AI and AR engineers to create a seamless product visualization tool that renders unavailable jewelry items in real time on an iPad.
AR/IoT-powered luxury retail experiences
AR/IoT-powered luxury retail experiences

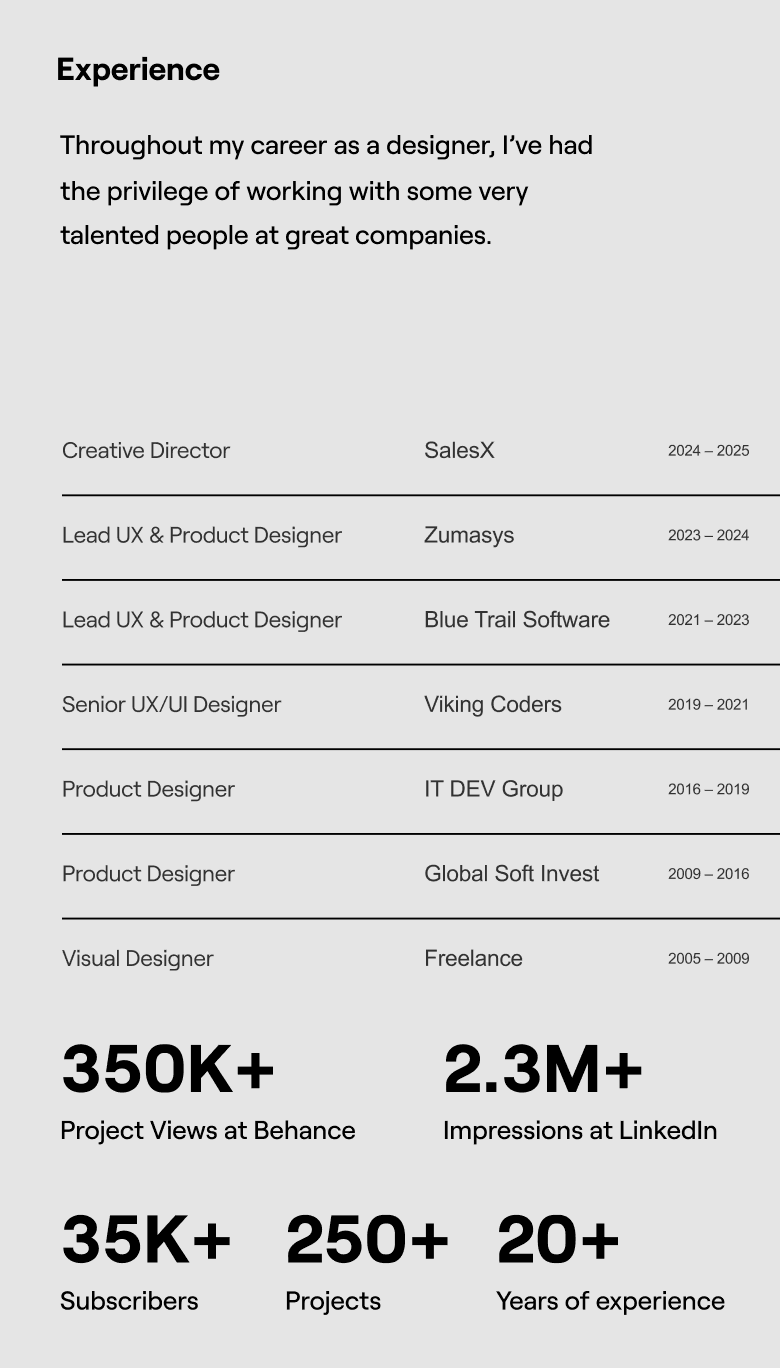
Creative Director
Creative Director
SalesX
SalesX
2024 – 2025
Lead UX & Product Designer
Lead UX & Product Designer
Zumasys
Zumasys
2023 – 2024
Lead UX & Product Designer
Lead UX & Product Designer
Blue Trail Software
Blue Trail Software
2021 – 2023
Senior UX/UI Designer
Senior UX/UI Designer
Viking Coders
Viking Coders
2019 – 2021
Product Designer
Product Designer
IT DEV Group
IT DEV Group
2016 – 2019
Product Designer
Product Designer
Global Soft Invest
Global Soft Invest
2009 – 2016
Visual Designer
Visual Designer
Freelance
Freelance
2005 – 2009

Experience
Throughout my career as a designer, I’ve had the privilege of working with some very talented people at great companies.
Empowering Design Teams
Beyond delivering impactful results, I’m dedicated to mentoring teams, fostering collaboration, and cultivating a strong design culture. With expertise in Figma, Adobe Creative Suite, and AI-powered technologies, I turn concepts into elegant, future-proof solutions.
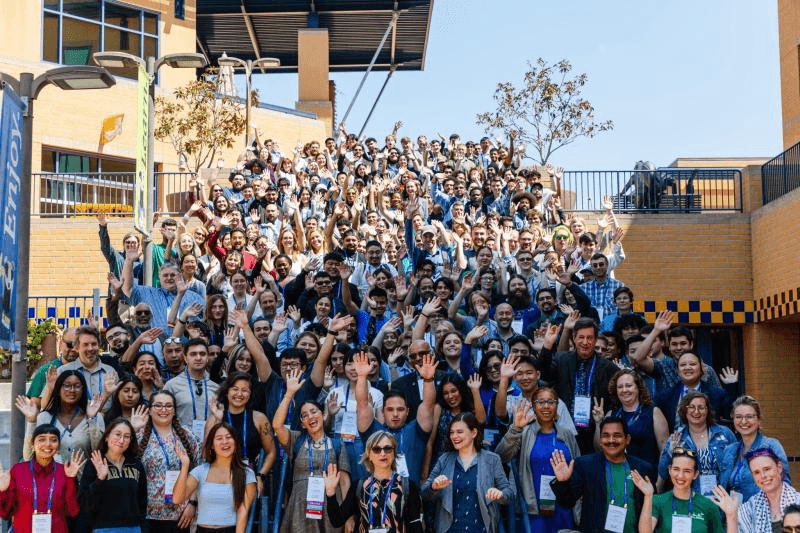
Proud to Be Part of UCI Designathon 2025 as a Judge and Mentor!
What an incredible weekend at UCI Designathon! I had the honor of joining as a judge and mentor, working alongside some of the most talented and driven students I’ve ever seen.

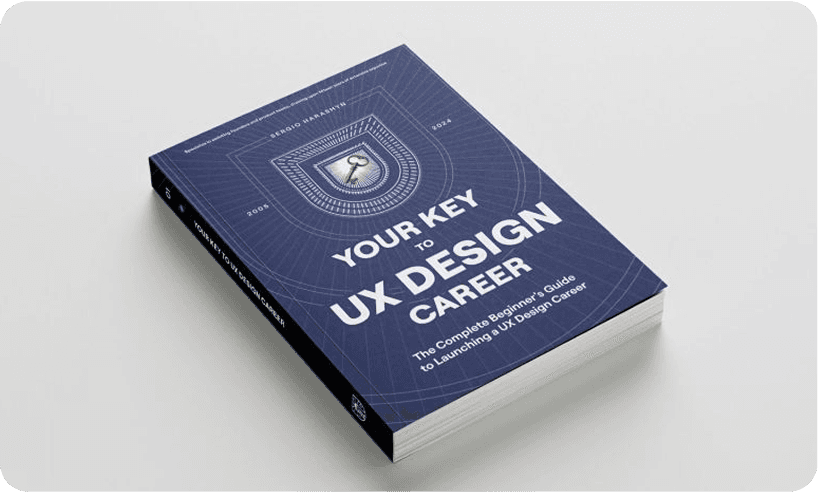
My Book: Your Key to a UX Design Career.
What an incredible weekend at UCI Designathon! I had the honor of joining as a judge and mentor, working alongside some of the most talented and driven students I’ve ever seen.
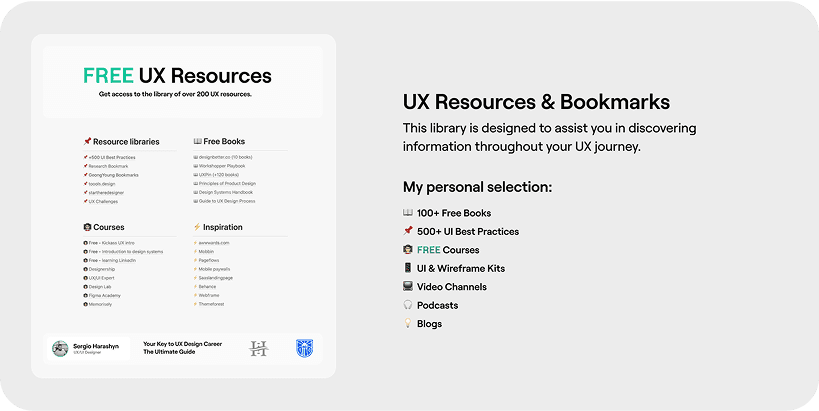
Get access to the library of over 200 UX resources.
I've gathered valuable materials to aid in your UX education. I prioritize the quality and suitability of resources, having personally vetted most links or received recommendations from trusted sources.
What matters most in digital marketing for 2025?
Always start with the trends that matter! Instead of asking how to follow the market, ask yourself how to lead it. Focus on staying ahead by adopting innovation, personalization, and sustainability strategies.


Interested in
working together?
Interested in
working together?
Interested in
working together?
Interested in
working together?
— award-winning product design
— award-winning product design
leader and mentor with 20+ years of experience driving innovation through design, collaborating with Cartier, Google, and UCI,
and focusing on how people think and innovate.
leader and mentor with 20+ years of experience driving innovation through design, collaborating with Cartier, Google, and UCI,
and focusing on how people think and innovate.